An easy introduction to Machine Learning part 1
Maybe you have already heard about machine learning and some of the amazing things it can do, in this series of posts I’m going to explain in a very easy way what machine learning is and why it is so important for the future of technology. Machine learning covers a lot of topics and can have a lot of ramifications, but I like to define it as a set of techniques and specialized algorithms that generate mathematical functions from pure data, the output of these generated functions are of our special interest because they can give us very good estimates about new data based on previous knowledge, in other words, this generated function will try to describe the data no matter how is structured.
An easy way to understand machine learning is to think of mathematical functions, for example when you write a program using a 3rd generation language like C# or Java, you think in variables, if-then statements, classes, methods, generics, loops etc. Now our goal is to create a program that outputs the computer price in USD dollars depending on the following characteristic:
• Cpu Speed
And you have the following dataset available, in this case, the price is given to you in terms of CPU Speed, here we say that the CPU Speed is a feature of the computer price because it influences the price:
| Cpu Speed(GHz) | Computer Price (USD) |
|---|---|
| 5.2 | 3000 |
| 4.4 | 2700 |
| 3.4 | 2500 |
| 2.1 | 600 |
Thinking in the code we want to create a function like this:
function  int CalculatePrice(int cpuSpeed){
    /*implementation*/
    return price;
}
Now our goal is to implement the body of this function, we can have some insights from the data, for example, is obvious that a high CPU speed appears to increase the total price of the computer this is they are directly proportional.
So we could write some code based on this insight:
function int CalculatePrice(int cpuSpeed){

    var cpuSpeedFactor = ? ; /* our guess */
    var price = cpuSpeed * cpuSpeedFactor;

    return price;
}
What value should the variable cpuSpeedFactor needs to be so that our function outputs the exact same values of our data-set? Ej:
//compare it to our data-set
CalculatePrice(5.2); // outputs 3000
CalculatePrice(4.4); // outputs 2700
CalculatePrice(3.4); // outputs 2500
CalculatePrice(2.1); // outputs 600
Because this is a very small data set we can try with different values and come up with an acceptable solution, for example, let’s say that cpuSpeedFactor = 200
\[5.2*200=1040 \text{ expected 3000}\\ 4.4*200=800 \text{ expected 2700}\\ 3.4*200=680 \text{ expected 2500}\\ 2.1*200=420 \text{ expected 600}\]Let’s calculate the total offset of our estimated values vs the values from the data set (the real values)
\[\lvert(3000-1040)\rvert+\lvert(2700-800)\rvert+\lvert(2500-680)\rvert+\lvert(600-420)\rvert=6100\]Our function predictions have an offset of 6100 USD dollars testing with our data set.
Now lets try another value for cpuSpeedFactor for example cpuSpeedFactor = 600
\[5.2*600=3120 \text{ expected 3000}\\ 4.4*600=2640 \text{ expected 2700}\\ 3.4*600=2040 \text{ expected 2500}\\ 2.1*600=1260 \text{ expected 600}\] \[\lvert(3000-3120)\rvert+\lvert(2700-2640)\rvert+\lvert(2500-2040)\rvert+\lvert(600-1260)\rvert=1300\]Our function predictions now have an offset of 1300 USD dollars this time, much better! but is there an optimum value for cpuSpeedFactor that produces the minimum offset (this is to be as close as possible to our dataset)?
Statistics to the rescue
It turns out that statistics can help us a lot here. Statistics uses mathematical methods that can adjust to data to help to gather additional insights. Let me explain you the most basic (but powerful) model in statistics, linear regression.
Linear Regression
Linear Regression is a mathematical model that tries to fit a formula of a straight line to a set of given points of data in a two-dimensional plane.
For example, let’s draw our given dataset (CPU speed vs computer price).
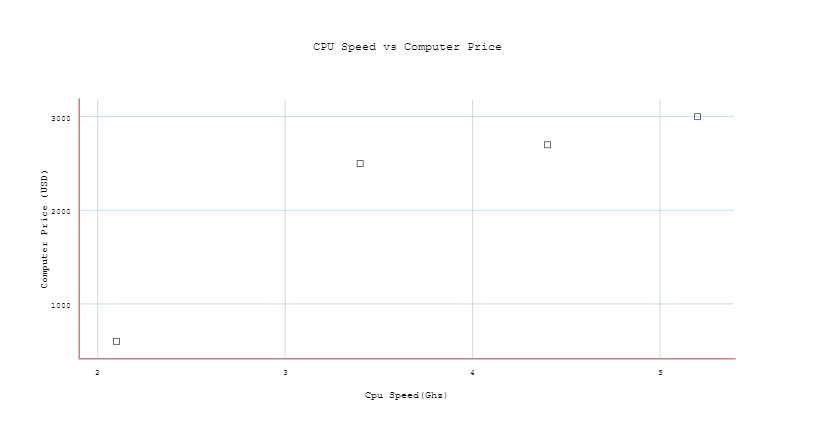
In this case, you have a bunch of points representing the relationship between CPU-speed and price, now with linear regression, you can model an equation that fits your data using a straight line, this line has the form of:
\[y = x*b+c\]where C is a constant that allows the straight line to translate vertically, x is the independent variable, in this case, the cpu_speed and y the dependent variable, in this case, the price.
What linear regression does is to try to create a linear relationship between our two variables based on all data points that exist on the plane, linear regression calculates the minimum distance for each data point to a straight line that covers the entire set of data (TODO explain in more detail how linear regression achieve this):
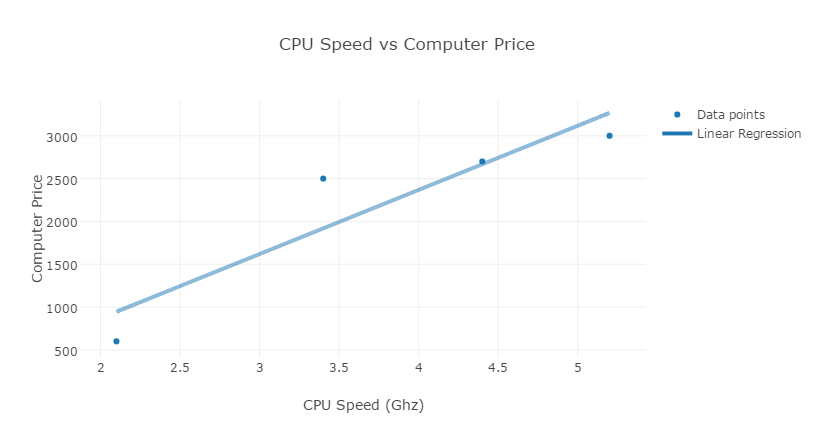
Our new straight line is described by the equation
\[y = x*(748.9520)+(-627.2939)\]where m equals to the constant 748.95 and b equals to the constant -627.29. This can also be interpreted as a unit increase in CPU speed is associated with 748.95 unit increase in the computer price.
A straight line that tries to cover the entire set of data points is really useful because we have an explicit guide that represents our data points, this line is represented by a mathematical function and because it is continuous it can output not only the values from the dataset but a lot of more values (infinite values). For example, we know that for CPU-speed of 5.2 Ghz the price is 3000 USD dollars but what about a new computer of speed 3.7 GHz? if we use our straight line as a reference we can get an estimate.
In statistics and machine learning, this new ability to estimate new unseen values from our fixed data is called prediction.
\(y=748.9520*x-627.2939\)
\(y=748.9520*3.7-627.2939\)
\(y=2143,8\)
Now let’s calculate the offsets of this function optimized by Linear Regression
\[5.2*748.9520-627.2939=3267,25 \text{ expected 3000}\\ 4.4*748.9520-627.2939=2668,09 \text{ expected 2700}\\ 3.4*748.9520-627.2939=1919,14 \text{ expected 2500}\\ 2.1*748.9520-627.2939=945,50 \text{ expected 600}\] \[\lvert(3000-3267,25)\rvert+\lvert(2700-2668,09)\rvert+\lvert(2500-1919,14)\rvert+\lvert(600-945,50)\rvert=1225,5\]Much better! here get an offsetting minor to the previous one ( 1225 vs 1300 ).
The prediction/estimation concept
This same prediction ability gives us the capability to generalize, that is to create a function that represents the entire set of data points and also represent the hidden rules and patterns that our data have implicitly (we are finding a pattern in our data), so that when a new value is evaluated by our function the new output will have coherence because is based on that pattern. A straight line generalizes very well to simple data, but that can be bad in some cases because if our data is very complex our function will only be able to represent it with a simple line resulting in wrong predictions, this is a well-known machine learning problem called underfitting, in this case when the data is very complex our model is not powerful enough to be able to fit the fixed data set.
For example with our data-set and our function fitted to our data we already have the ecuation:
\[y=748.9520*3.7-627.2939\]if we want to know the income of a new age value (a value that we never registered in our data points) we can predict it or what I like to call it better “estimate it”, this value is using our statistical linear regression model will give us a very good approximate value.
I like to think that Linear Regression is the most basic form of Machine Learning, because when you research more on the topic you can somehow see that even the most complex Machine Learning Algorithms at a deep level are trying to behave the same like Linear Regression, that is, trying to model a mathematical equation from data to try to describe in the best way possible the data set.
Of course, the value that our model gives us is not an exact value, it is an approximation and for most of the real world problems that machine learning tackles this is acceptable.
More Variables
Now back to our example, let’s say that now our dataset has more variables available, this means now that our computer price is described not only by the CPU speed but by:
• Memory Ram
• Cache
• Flops
• Reads per second
• Writes per second
So our new data-set is:
| Cpu Speed(Ghz) | Ram (Gb) | Cache (Mb) | Flops | Reads Per Second | Writes per Second | Computer Price (usd) |
|---|---|---|---|---|---|---|
| 5.2 | 10 | 2 | 3500 | 4500 | 1500 | 3000 |
| 4.4 | 7 | 1 | 2500 | 2500 | 1500 | 1500 |
| 3.4 | 7 | 2 | 1500 | 4500 | 1500 | 2500 |
| 2.1 | 2 | 1 | 1000 | 3000 | 1500 | 1000 |
Now as before we want to create a function like this
function  int CalculatePrice(int cpuSpeed, int ram, int cache, int flops, int reads, int writes){
    /*implementation*/
    return price;
}
Just as before we could write some code based on this analysis:
function CalculatePrice(cpuSpeed, ram, cache, flops, reads, writes){

    var cpuSpeedFactor = 9;
    var ramFactor = 8;
    var cacheFactor = 6;
    var flopsFactor = 5;
    var readsFactor = 4;
    var writesFactor = 3;

    var price = cpuSpeed*cpuSpeedFactor+ram*ramFactor+cache*cacheFactor+flops*flopsFactor+reads*readsFactor+writes*writesFactor;

    return price;
}
I ‘ve created some factor variables that give each corresponding parameter a weight the bigger the factor the more it influences the total price. Also, I ‘ve have assigned a higher value to the cpuSpeedFactor variable based on my own intuition, this function will give us an approximation based on my own judgment. The problem with this approach as stated before is that we don’t know how to specify the constant values or weights for each variable, we are just guessing here, but for example, we don’t know if CPU speed has an impact on the total computer by a factor of 9. The same applies for the rest of the factor variables, we don’t have any real clue how they influence the final computer price.
Maybe we can come up with a combination of factor variables in such a way that they represent our data exactly. But, ¿what if we have to guess the price of a new computer with new specs that are not registered on our dataset? ¿what price will our custom function output? ¿it will be a precise value? ¿will our output has coherence with the dataset?. As you can see its very difficult to extract logic from data, maybe for this small data set of 4 rows is achievable, but ¿what if we have a dataset of +100 rows? it would be extremely difficult to think of some function that represents the dataset correctly.
Lets output the values of our function, with the same inputs from our new data-set:
//compare it to our data-set
CalculatePrice(5.2,10,2,3500,4500,1500,3000); // outputs 40138.8 vs 3000
CalculatePrice(4.4,7,1,2500,2500,1500,1500); // outputs 27101.6 vs 1500
CalculatePrice(3.4,7,2,1500,4500,1500,2500); // outputs 30098.6 vs 2500
CalculatePrice(2.1,2,1,1000,3000,1500,1000); // outputs 21540.9 vs 1000
As you can see our new function outputs very different values as those from the dataset, in this case, is becoming much harder to guess a correct weight for each of the variables.
Now we know is better to let a statistical algorithm do the hard work, but we have a problem, now we have 6 independent variables on our problem and linear regression only works with one independent variable.
Selecting the Statistical Model
This situation happens a lot in machine learning, our problem now is more complex and we as data scientist need to select the most appropriate model to tackle the problem. The truth is that we have a lot of models to choose for, there are TONS of models and possible solutions to this problem, and as we are going to see in a future chapter most of them do a great work!. In this case, we could use a multivariable statistical model like Multiple Variable Linear Regression. To solve this I will rely on the statsmodels libraries, statsmodels is a Python module that provides many tools and statistical models ready to use, in this case, their linear regression implementation also includes multiple variable support specifically I will be using the OLS library that stands for Ordinary Least Squares.
import statsmodels.formula.api as smf

# read data into a panda DataFrame
data = pd.read_csv('dataseturl', index_col=0)
data.head()
# print the shape of the DataFrame
data.shape
lm = smf.ols(formula='Computer Price vs RAM Cache Flops Reads Per Second Writes per Second', data=data).fit()
# print the coefficients
lm.params